
成长股估值处于历史高位。年初以来创成长指数是A股所有指数中涨幅最高的。截止2021年7月21日,上涨31.6%。创成长指数包括50只创业板个股,其中前10大权重股占创成长市值的73.6%。前十大权重股分别是宁德时代(权重为17.2%,下同)、东方财富(13.8%)、爱尔眼科(9.1%)、亿纬锂能(7.4%)、卓胜微(7.2%)、汇川技术(6.4%)、爱美客(3.6%)、阳光电源(2.9%)、智飞生物(2.88%)和欧普康视(2.76%)。这10大权重股中静态市盈率最低的是东方财富,60倍;最高的是爱美客,394倍。创成长指数总体静态市盈率为84.8倍,处在历史上86.7%的分位。当前估值水平低于2020年7月和2021年2月高点的估值水平,创成长指数在前述两个时间点的静态市盈率分别为102.7和95倍。创成长指数分别从前两次的高点回落18.7%和29.8%。无论是电动车还是医美或者光伏板块,当前都处在情绪比较热的阶段,市场有可能随时发生调整。将创成长指数与银行指数的估值进行对比,可以发现创成长对银行指数的估值比率已经达到2021年来的高点(图一)。当前位置该比值为12.5,超过2021年1月下旬的高点12。银行股是价值股的典型代表。这也意味着成长对价值的估值达到了较高水平。全球来看,价值股在过去15年跑输成长股。成长股的盈利增速总是高于价值股,问题是高多少和投资人支付的价格是多少。根据有关机构对全球2000只股票的加权平均统计,成长股从1990年到2021年6月30日,每年比价值股的盈利增速高2.6个百分点。所以,盈利增速并没有差太多。成长股的估值贵主要是投资人对他们的盈利预期过高造成的。而根据杰里米·西格尔在《投资者的未来》中所指出的:投资收益来自预期差,即企业实际业绩增速与预期业绩增速之差。对于成长股而言,因为预期高,所以估值很高,但是实际上经常会有令投资人失望的股票。历史上看,有成长股股价下跌而引发市场危机的例子,最典型的就是2000年互联网泡沫破裂。
图一:创成长指数与银行指数静态市盈率比值
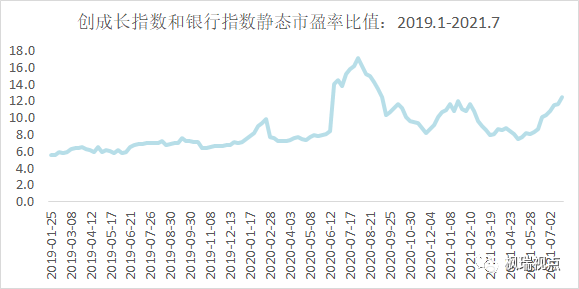
数据来源:WIND
周二A股强劲反弹,港股微跌。欧美股市继续大幅反弹。经过周二和周三两天的反弹,美股收回周一的全部跌幅。经济复苏股引领股市上涨。10年期国债收益率上涨8个基点达到1.29%,美元指数从93高位回落,原油价格回升到70美金每桶以上。
Growth stocks’ valuation to value stocks reached a new high. The best performing index in A-share is Chinext Momentum Growth Index, which rose 31.6% year-to-date. The top-ten weighting stocks in terms of market cap comprise 73.6% of the index. The biggest weighting stock is Contemporary Amperex Technology, which takes 17.3% of the index weighting. East Money Information is the cheapest stock among the top 10 at trailing-twelve-month price-to-earnings ratio (TTW PE) of 60x while Imerk Technology is the most expensive at TTW PE of 394x. Chinext Momentum Growth index is valued at TTW PE of 84x, which put it at 86.4% percentile since it was set up in Jan. 2019. This compared with 102.7x and 95x in July 2020 and Feb. 2021, the previous two highs for the index. The index then corrected close to 20% and 30% respectively from these two highs. Moreover, the ratio of Chinext Momentum Growth Index TTW PE to that of bank sector also reached a new high in 2021. The ratio was 12.5x, higher than 12x at the end of Jan. this year but lower than 14x in July 2020. According to a statistic on 2000 global stocks the weighted average earnings growth rate of growth stocks is 2.6 percentage point higher than that of value stocks on annualized basis from 1990 to June 30th 2021. In a word the growth stocks only grow a little faster than value stocks. The high valuation of growth stocks is due to the high expectation of investors. Jeremy Siegel pointed out in his famous book “The future for investors” that investment return is determined by the gap between expectation and actual earnings growth.For growth stocks it frequently turns out that the actual earnings growth is lower than expected. Hence, when growth stocks correct the impact to the market is usually quite big. A case in point is the internet bubble burst in 2000.
A-share rose and HK market fellslightly. The US and European market continued to rebound strongly and most of them recouped the losses on Monday after the rally on Tuesday and Wednesday.
声明:本市场点评由北京枫瑞资产管理有限公司(以下简称“枫瑞资产”)“枫瑞视点”微信公众号提供和拥有版权,授权上海海狮资产管理有限公司转载。在任何情况下文中信息或所表述的意见不构成对任何人的投资建议,枫瑞资产不对任何人因使用本文中的内容所引发的损失负任何责任。未经枫瑞资产书面授权,本文中的内容均不得以任何侵犯枫瑞资产版权的方式使用和转载。市场有风险,投资需谨慎。
免费咨询电话:0757-2833-3269 或 131-0659-0746
公司名称:上海海狮资产管理有限公司 HESS Capital, LLC
公司地址:广东省佛山市顺德区天虹路46号信保广场南塔808
Copyright 2014-2020 上海海狮资产管理有限公司版权所有
沪ICP备2020029404号-1